> ## Documentation Index
> Fetch the complete documentation index at: https://iii.dev/docs/llms.txt
> Use this file to discover all available pages before exploring further.
# Ch. 2: Observe everything
> Watch Linkly run live in the iii console, then read the same logs and traces from the engine.
Observability in iii isn't something you bolt onto each service. Every cross-worker call already
flows through the engine, so the engine can trace and log the whole system end to end. In this
chapter you open the console to see that, then, if you want, read the same data directly from the
engine.
## Open the console
The engine has been running since Chapter 1. Start the console, a browser UI for inspecting it:
```bash theme={"theme":{"light":"catppuccin-latte","dark":"dark-plus"}}
iii console
```
Open it at [http://127.0.0.1:3113/traces](http://127.0.0.1:3113/traces). Every worker you added is
listed with the functions and triggers it registered. Navigate to the traces tab and run the below
command to watch the invocations stream live:
```bash theme={"theme":{"light":"catppuccin-latte","dark":"dark-plus"}}
curl -s -X POST http://127.0.0.1:3111/links \
-H 'Content-Type: application/json' -d '{"url":"https://iii.dev","code":"iii"}'
for n in $(seq 1 5); do curl -s -o /dev/null http://127.0.0.1:3111/s/iii; done
```
Click any redirect to see a full waterfall of timed spans crossing from `iii-http` into `link` and
back:
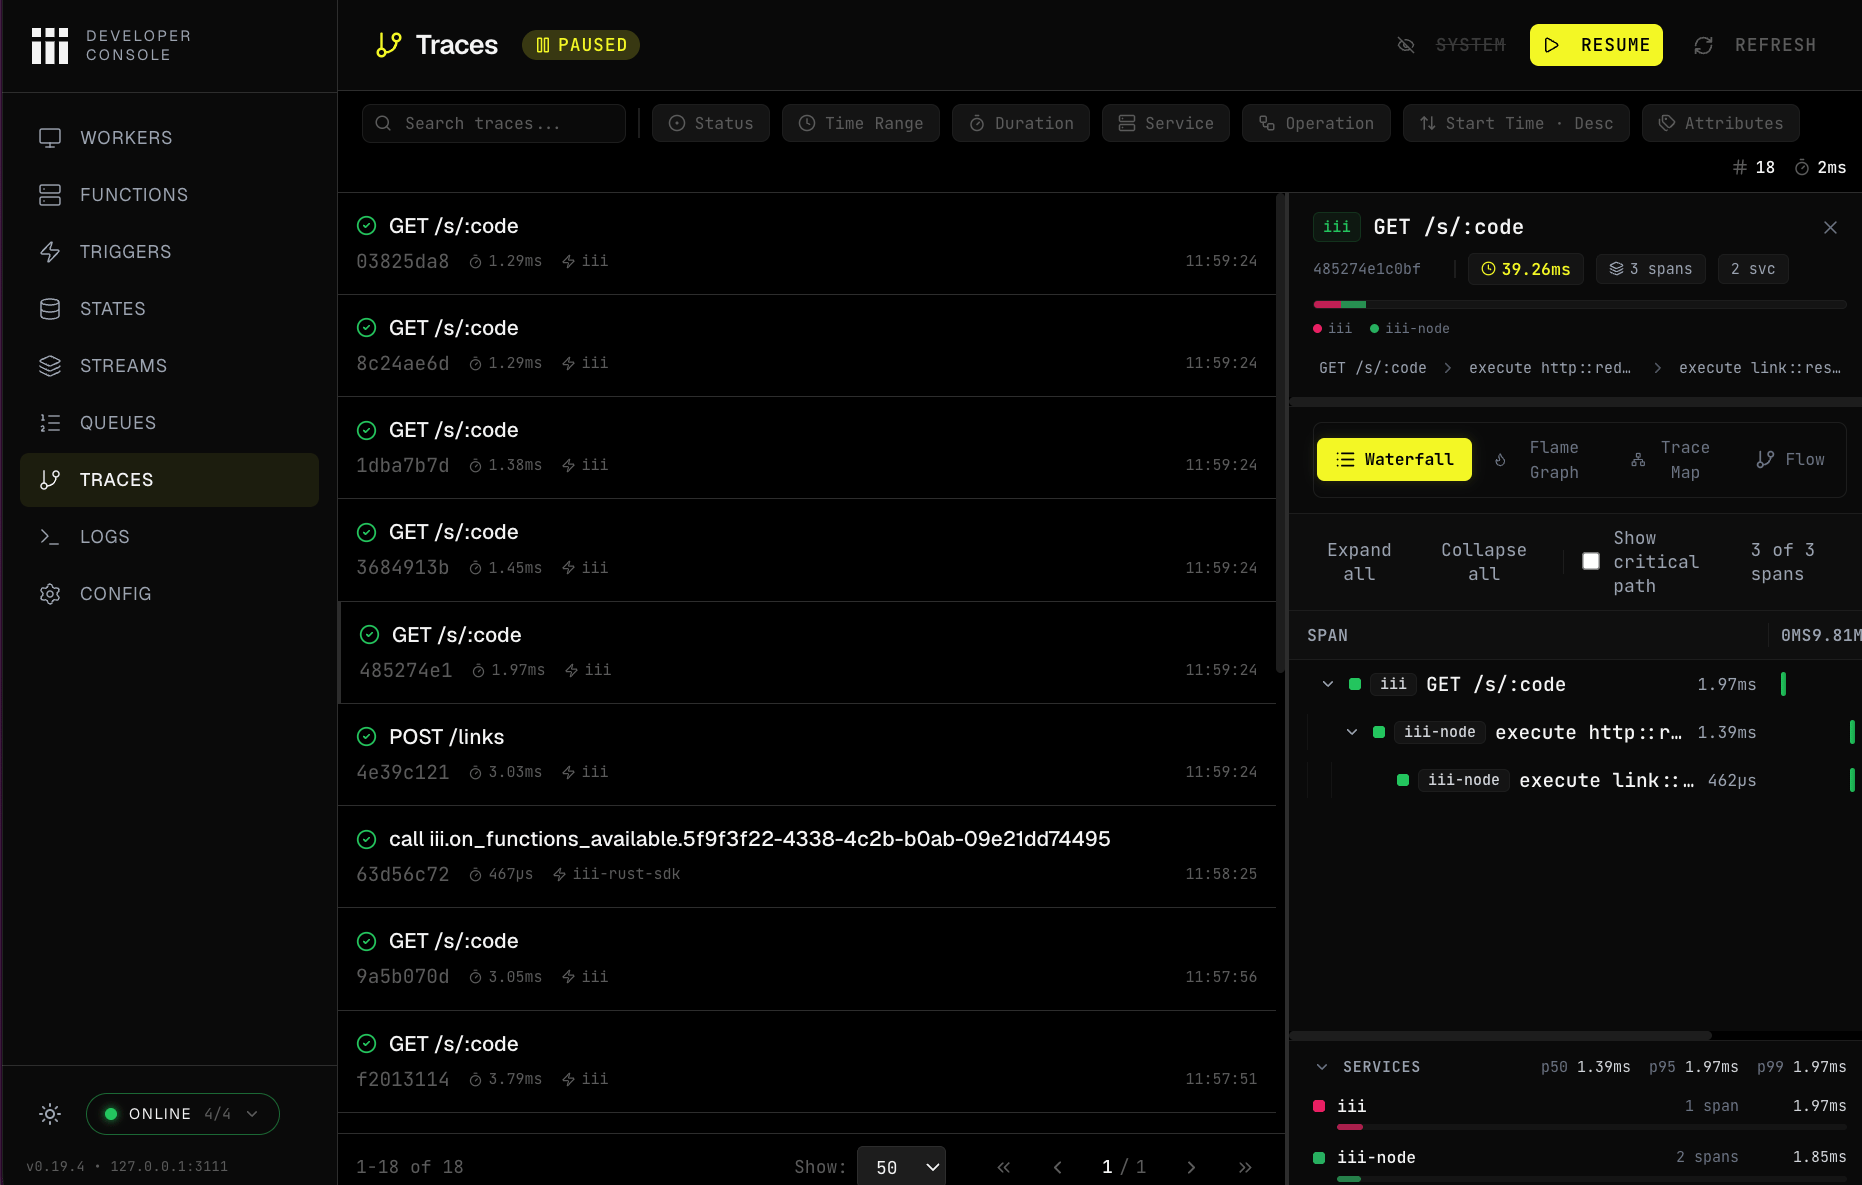 You didn't add a tracing library or thread a request ID between services to get this.
`iii project init` added the `iii-observability` worker to `config.yaml`, and from then on every
request gets a trace and every `Logger` line is collected automatically, across workers. In iii
end-to-end observability is an inherent property of the system.
**iii-observability emits OpenTelemetry.** Its traces, metrics, and logs are emitted as OTel, so
you aren't locked into the console. You can point the worker at Honeycomb, Grafana, Datadog, or
any other OTel-compatible backend. See the worker's configuration on
[workers.iii.dev/workers/iii-observability](https://workers.iii.dev/workers/iii-observability).
For most teams the console (or your own OTel backend) is all you need day to day.
The rest of this chapter is an optional deep dive on how to read the same logs and traces directly
from the engine. You can jump to [Ch. 3: Persist everything](/tutorials/linkly/persistence) if you
prefer.
## Read the logs
Create some traffic:
```bash theme={"theme":{"light":"catppuccin-latte","dark":"dark-plus"}}
curl -s -X POST http://127.0.0.1:3111/links \
-H 'Content-Type: application/json' -d '{"url":"https://iii.dev","code":"iii"}'
for n in $(seq 1 5); do curl -s -o /dev/null http://127.0.0.1:3111/s/iii; done
curl -s -o /dev/null http://127.0.0.1:3111/s/missing
```
Then check the logs:
```bash theme={"theme":{"light":"catppuccin-latte","dark":"dark-plus"}}
iii trigger engine::logs::list limit=100 \
| jq '.logs[]
| select(.body == "link resolved")
| { body,
data: (.attributes | with_entries(select(.key | IN("trace_id","span_id","service.name") | not))),
trace_id,
service_name }'
```
The `jq` pipe filters the response down to the `link resolved` entries and keeps the parts that
matter for this tutorial, try removing it to see all the information the iii engine can provide.
```json theme={"theme":{"light":"catppuccin-latte","dark":"dark-plus"}}
{
"body": "link resolved",
"data": {
"log.data": {
"code": "iii",
"found": true
}
},
"trace_id": "797d427e4d0c3491cfc45f0d40c4e1b1",
"service_name": "iii-node"
}
```
`data` is exactly what you passed to `logger.info`; the engine stores those fields as individual log
attributes, so the `jq` above gathers everything except the OTel metadata keys. The `trace_id` ties
the log to the trace it came from, which is where you look next.
## Follow a redirect across workers
Everything that happens on a iii system has a trace. So the http requests have traces that cover the
full execution context of the request. Grab the most recent redirect's `trace_id` and walk the whole
request as a tree. Capturing the id into a shell variable keeps this a single paste:
```bash theme={"theme":{"light":"catppuccin-latte","dark":"dark-plus"}}
trace_id=$(iii trigger engine::traces::list name="GET /s/:code" limit=1 | jq -r '.spans[0].trace_id')
iii trigger engine::traces::tree trace_id="$trace_id" | jq -r '
def walk(depth):
(" " * depth // "") + .name + " (" + .service_name + ") "
+ (((.end_time_unix_nano - .start_time_unix_nano) / 1e6 * 1000 | round) / 1000 | tostring) + " ms",
(.children[]? | walk(depth + 1));
.roots[] | walk(0)
'
```
The `jq` pipe walks the nested `roots` tree, indenting each span by depth and printing its
`service_name` and duration in milliseconds. You get the full path of one redirect, across two
workers:
```text theme={"theme":{"light":"catppuccin-latte","dark":"dark-plus"}}
GET /s/:code (iii) 2.044 ms
execute http::redirect (iii-node) 1.444 ms
execute link::resolve (iii-node) 0.52 ms
```
This shows the redirect arriving through `/s/:code` via the `iii-http` worker's Trigger, calling
`http::redirect` in `link`, which then calls `link::resolve` in the `link` worker via the engine.
The per-span timing shows where the request spends its time.
Worker spans export on a short delay, so a brand-new request's trace can be missing or look
truncated for a second or two. If you encounter this wait a few seconds and try again.
## Compare traces to find the slowest links
To compare many traces it's possible to filter, list, and sort them in one operation. Here are the
redirect spans sorted by duration, slowest first:
```bash theme={"theme":{"light":"catppuccin-latte","dark":"dark-plus"}}
iii trigger engine::traces::list name="GET /s/:code" sort_by=duration_ms sort_order=desc limit=10 \
| jq -r '.spans[]
| "\(((.end_time_unix_nano - .start_time_unix_nano) / 1e6 * 1000 | round) / 1000) ms \(.trace_id)"'
```
Each line pairs a duration with its `trace_id`, slowest first:
```text theme={"theme":{"light":"catppuccin-latte","dark":"dark-plus"}}
2.044 ms 6b20e1fe001742c25bb7dc570b57fe42
1.700 ms 797d427e4d0c3491cfc45f0d40c4e1b1
```
The slowest redirects rise to the top; open any one's `trace_id` with `engine::traces::tree` to see
which hop is responsible.
## Conclusion
Linkly is now observable: the console shows every worker, trace, and log as it happens, and you can
read the same data from the engine with `iii trigger`. The links are still kept only in memory,
though, so restarting the engine clears them. Next, in
[Ch. 3: Persist everything](/tutorials/linkly/persistence), you move them into durable storage.
You didn't add a tracing library or thread a request ID between services to get this.
`iii project init` added the `iii-observability` worker to `config.yaml`, and from then on every
request gets a trace and every `Logger` line is collected automatically, across workers. In iii
end-to-end observability is an inherent property of the system.
**iii-observability emits OpenTelemetry.** Its traces, metrics, and logs are emitted as OTel, so
you aren't locked into the console. You can point the worker at Honeycomb, Grafana, Datadog, or
any other OTel-compatible backend. See the worker's configuration on
[workers.iii.dev/workers/iii-observability](https://workers.iii.dev/workers/iii-observability).
For most teams the console (or your own OTel backend) is all you need day to day.
The rest of this chapter is an optional deep dive on how to read the same logs and traces directly
from the engine. You can jump to [Ch. 3: Persist everything](/tutorials/linkly/persistence) if you
prefer.
## Read the logs
Create some traffic:
```bash theme={"theme":{"light":"catppuccin-latte","dark":"dark-plus"}}
curl -s -X POST http://127.0.0.1:3111/links \
-H 'Content-Type: application/json' -d '{"url":"https://iii.dev","code":"iii"}'
for n in $(seq 1 5); do curl -s -o /dev/null http://127.0.0.1:3111/s/iii; done
curl -s -o /dev/null http://127.0.0.1:3111/s/missing
```
Then check the logs:
```bash theme={"theme":{"light":"catppuccin-latte","dark":"dark-plus"}}
iii trigger engine::logs::list limit=100 \
| jq '.logs[]
| select(.body == "link resolved")
| { body,
data: (.attributes | with_entries(select(.key | IN("trace_id","span_id","service.name") | not))),
trace_id,
service_name }'
```
The `jq` pipe filters the response down to the `link resolved` entries and keeps the parts that
matter for this tutorial, try removing it to see all the information the iii engine can provide.
```json theme={"theme":{"light":"catppuccin-latte","dark":"dark-plus"}}
{
"body": "link resolved",
"data": {
"log.data": {
"code": "iii",
"found": true
}
},
"trace_id": "797d427e4d0c3491cfc45f0d40c4e1b1",
"service_name": "iii-node"
}
```
`data` is exactly what you passed to `logger.info`; the engine stores those fields as individual log
attributes, so the `jq` above gathers everything except the OTel metadata keys. The `trace_id` ties
the log to the trace it came from, which is where you look next.
## Follow a redirect across workers
Everything that happens on a iii system has a trace. So the http requests have traces that cover the
full execution context of the request. Grab the most recent redirect's `trace_id` and walk the whole
request as a tree. Capturing the id into a shell variable keeps this a single paste:
```bash theme={"theme":{"light":"catppuccin-latte","dark":"dark-plus"}}
trace_id=$(iii trigger engine::traces::list name="GET /s/:code" limit=1 | jq -r '.spans[0].trace_id')
iii trigger engine::traces::tree trace_id="$trace_id" | jq -r '
def walk(depth):
(" " * depth // "") + .name + " (" + .service_name + ") "
+ (((.end_time_unix_nano - .start_time_unix_nano) / 1e6 * 1000 | round) / 1000 | tostring) + " ms",
(.children[]? | walk(depth + 1));
.roots[] | walk(0)
'
```
The `jq` pipe walks the nested `roots` tree, indenting each span by depth and printing its
`service_name` and duration in milliseconds. You get the full path of one redirect, across two
workers:
```text theme={"theme":{"light":"catppuccin-latte","dark":"dark-plus"}}
GET /s/:code (iii) 2.044 ms
execute http::redirect (iii-node) 1.444 ms
execute link::resolve (iii-node) 0.52 ms
```
This shows the redirect arriving through `/s/:code` via the `iii-http` worker's Trigger, calling
`http::redirect` in `link`, which then calls `link::resolve` in the `link` worker via the engine.
The per-span timing shows where the request spends its time.
Worker spans export on a short delay, so a brand-new request's trace can be missing or look
truncated for a second or two. If you encounter this wait a few seconds and try again.
## Compare traces to find the slowest links
To compare many traces it's possible to filter, list, and sort them in one operation. Here are the
redirect spans sorted by duration, slowest first:
```bash theme={"theme":{"light":"catppuccin-latte","dark":"dark-plus"}}
iii trigger engine::traces::list name="GET /s/:code" sort_by=duration_ms sort_order=desc limit=10 \
| jq -r '.spans[]
| "\(((.end_time_unix_nano - .start_time_unix_nano) / 1e6 * 1000 | round) / 1000) ms \(.trace_id)"'
```
Each line pairs a duration with its `trace_id`, slowest first:
```text theme={"theme":{"light":"catppuccin-latte","dark":"dark-plus"}}
2.044 ms 6b20e1fe001742c25bb7dc570b57fe42
1.700 ms 797d427e4d0c3491cfc45f0d40c4e1b1
```
The slowest redirects rise to the top; open any one's `trace_id` with `engine::traces::tree` to see
which hop is responsible.
## Conclusion
Linkly is now observable: the console shows every worker, trace, and log as it happens, and you can
read the same data from the engine with `iii trigger`. The links are still kept only in memory,
though, so restarting the engine clears them. Next, in
[Ch. 3: Persist everything](/tutorials/linkly/persistence), you move them into durable storage.